Dear dbehr01,
I am a geologist and a professional avalanche forecaster and I use MAPIR equipment to define the surface characteristics of the snowpack while the
EVO II camera is also used for normal photogrammetry (creation of the DSM/DTM). I therefore have no practical experience in the field of agriculture (apart from a few attempts out of pure personal curiosity on wineyards) although I have good skills in the use and interpretation of multispectral images.
I use one OCN (Orange, Cyan, Near Infrared) and one NGB (Near Infrared, Green, Blue) MAPIR survey3 camera and this is sufficient for my needs. There are two possible ways to process the indices: use specific software with numerous presets (but they have the disadvantage of being quite expensive and often limit the processing to the presets available, it is obvious that the more you pay, the more the software allows you to process); use GIS software (QGIS, SAGA, ESRI ArcGIS) with some plug-ins (this second option requires an advanced mastery of GIS tools and a minimum of competence in the field of spectral indices but offers the maximum flexibility and processing capacity). MAPIR makes its own plugin available for QGIS and Micasense, I believe, has also done something similar.
Here's how I would proceed if I were you: a) you have to search online for the reference reflectance spectrum for the type of plant you want to analyse. Every mineral, plant or animal on the surface of the earth has its own spectrum and knowing this spectrum allows you to work out which bands to use to extract the information you are looking for. For plants, I know that there are reference spectra for the same plant species in different states of health and degree of growth. Alternatively you can use the simplest indices (e.g. NDVI) but there are up to 62 different indices that allow you to measure chlorophyll content, photosynthetic activity, absorbed energy, hydration state, carotenoid or anthocyanin content,etc.. b) Before the field survey, you should always measure the reflected solar radiation on the reference panel provided with the camera (remember that if the sky conditions change significantly - shadows, clouds, etc. - it is advisable to interrupt the survey and redo the measurement on the reference panel); c) once you have acquired the multispectral images, you can analyse them individually (one frame for each band of your sensor) or assemble them first in a photomosaic (again one for each band of your sensor) and then analyse them. To do this, you can use photogrammetry software (Pix4d; AgisoftMetashape; WebODM; RealityCapture), some of which are already set up to work with hyperspectral images.
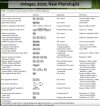
On YouTube look for the following channels for better hints: MAPIR Camera; MicaSense; Travis Parker; Hans van der Kwast; UCANR-IGIS. Please find attached a table list of the main indexes. Regards, Avy2IT